
Most prop traders stick to forex pairs and indices. The ones trading commodities, particularly gold and oil, often have an edge, but only if they understand how these markets actually move.
Gold isn't just "another chart." Oil doesn't care about your technical setup when the EIA report drops.
This guide breaks down what prop traders need to know about commodities: the mechanics that drive price, the specific windows when these markets move, and the correlations that can either confirm your thesis or blow up your account.
Why Commodities Behave Differently
Commodities are priced in US dollars globally. This creates a mechanical relationship that doesn't exist in forex pairs: when the dollar strengthens, it takes fewer dollars to buy the same barrel of oil or ounce of gold. When the dollar weakens, prices rise, not because demand changed, but because the measuring stick did.
Research using data from 1976 to 2017 found that a 1% increase in the dollar's value depresses gold prices by approximately 3.09%. Between 2004 and 2006, the correlation between gold and the US Dollar Index sat at −0.44. From 2001 to 2009, the relationship was nearly perfect negative correlation.
This matters for prop traders because it gives you a cross-check that doesn't exist in other markets. If you're long gold and the DXY is breaking out to new highs, you have a problem, regardless of what the gold chart looks like.
Trading Gold: The Setup
Gold trades 23 hours a day, but not all hours are equal.
The London-New York overlap (8:00 AM–12:00 PM ET) is where the action happens. Liquidity peaks, spreads tighten, and the moves that matter occur. Data shows particularly strong price action around 8:00 AM New York time, often tied to US economic releases.
The New York session (8:00 AM–5:00 PM ET) dominates gold trading because the metal is heavily influenced by US economic data, interest rate decisions, and dollar movements. This is when you want to be active.
Asian session hours are typically calmer unless major news breaks from China or Australia. For prop traders, this often means wider spreads and choppier price action, not ideal for hitting profit targets.
What Actually Moves Gold
Forget the "safe haven" narrative for a moment. Here's what drives gold prices mechanically:
- Real interest rates. When US Treasury yields rise faster than inflation expectations, gold gets crushed. When real rates fall or go negative, gold rallies. This is the dominant driver.
- Federal Reserve policy. FOMC announcements at 2:00 PM ET cause large swings. If you're holding gold through a Fed decision, you're gambling, not trading.
- Central bank buying. Goldman Sachs expects central banks to purchase 70 tonnes of gold per month in 2026, four times the pre-2022 average. China, Turkey, Russia, and India continue accumulating. This creates a structural bid under the market.
- Inflation data. CPI releases at 8:30 AM ET move gold significantly. Hot inflation prints typically boost gold; cooler prints do the opposite.
Gold Technical Framework for Prop Accounts
The volatility of gold demands wider stops than forex pairs. A practical approach:
- ATR-based stops. Place your stop-loss 1.5 to 2 times the current Average True Range from your entry. Gold's natural volatility means tight stops get hunted constantly.
- Moving average structure. A 20-period EMA crossing above the 50-period EMA signals potential uptrends. Add RSI confirmation: look for RSI above 50 in uptrends, below 50 in downtrends.
- Fibonacci levels. The 38.2%, 50%, and 61.8% retracement levels remain relevant in gold. Use them for entry placement on pullbacks and stop-loss positioning.
The Prop Account Trap
Gold's 200+ pip news moves can blow through trailing drawdowns mid-rally. If your firm uses trailing drawdowns that follow your equity high, a sharp pullback after a winning run can breach your account even though you're net profitable.
Check your firm's drawdown rules before trading gold. Static daily drawdowns are more forgiving for commodity volatility than trailing mechanisms.
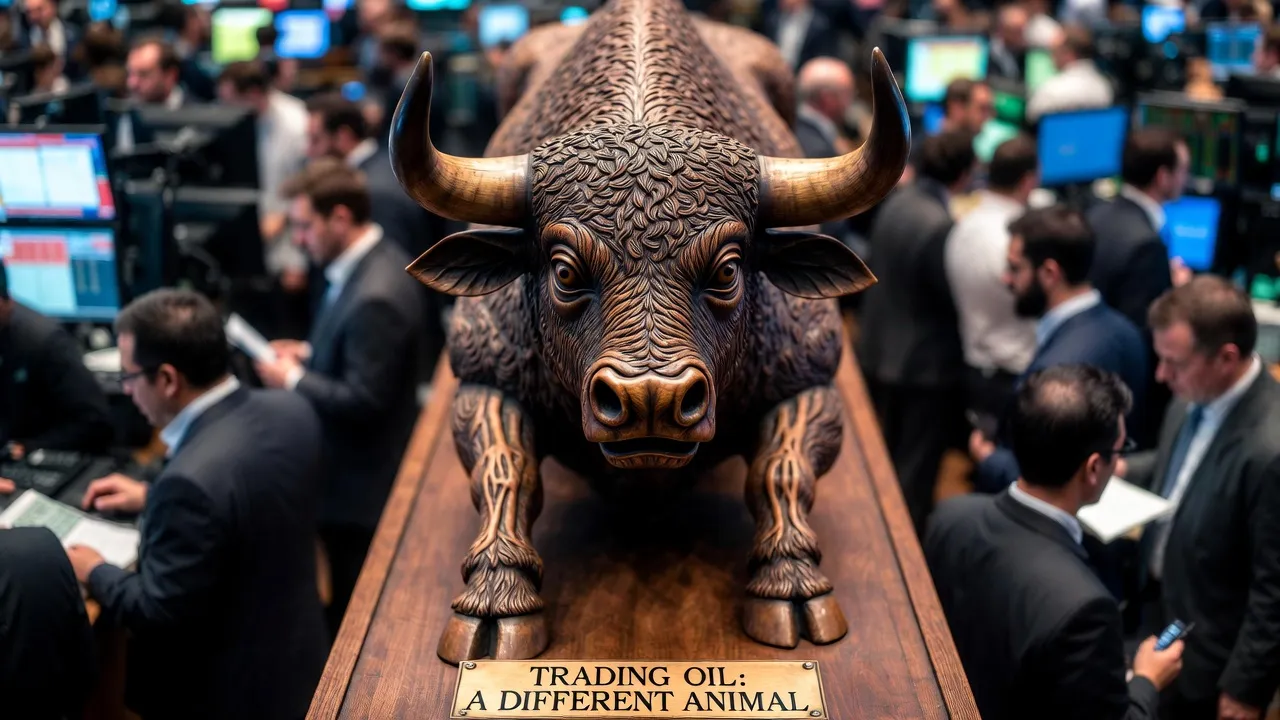
Trading Oil: A Different Animal
Oil is more event-driven than gold. The weekly calendar matters more than the chart.
The Events That Move Oil
EIA Crude Inventory Report (Wednesdays, 10:30 AM ET). This is the oil trader's non-farm payrolls. The Energy Information Administration releases weekly US crude stockpile data, and oil prices react immediately.
The mechanics: if crude inventories build more than expected, it implies weaker demand and is bearish for prices. If inventories draw more than expected, it signals stronger demand and is bullish.
API Report (Tuesdays, 4:30 PM ET). The American Petroleum Institute releases its inventory estimate the evening before the EIA. Results typically fall within 1% of the EIA data 75% of the time.
OPEC+ Meetings. When the 14 top exporting countries gather, oil markets listen. OPEC production quotas directly affect supply. Lower quotas tighten supply and push prices higher.
Oil's Macro Setup for 2026
The supply picture is bearish. Goldman Sachs projects WTI averaging $52/barrel, with non-OPEC supply growing three times faster than demand. JP Morgan has flagged tail risk of Brent falling into the low $30s if supply expansion continues unchecked.
For prop traders, this macro backdrop suggests:
- Rallies may be selling opportunities rather than breakout entries
- Mean reversion strategies may outperform trend-following in oil
- Position sizing should account for potential 50% moves in either direction
The Dollar Correlation: Your Edge or Your Blind Spot
The DXY (Dollar Index) is your cross-market confirmation tool. Here's how to use it:
For gold trades: If you're bullish gold and DXY is approaching resistance and showing signs of reversal, your gold thesis has tailwinds. If DXY is breaking out higher while you're trying to buy gold, reconsider. You're fighting the dominant correlation.
For oil trades: The same inverse relationship exists, though it's less consistent than with gold. A weaker dollar makes oil cheaper for international buyers, supporting demand.
When the correlation breaks: During genuine crisis scenarios, both gold and the dollar can rise simultaneously as safe-haven demand spikes. This happened briefly in March 2020. In these periods, trade the individual asset's structure rather than assuming the inverse relationship holds.
Position Sizing for Commodity Volatility
Gold's average daily range is significantly larger than major forex pairs. Oil can move 5-10% on inventory surprises or OPEC decisions. Standard forex position sizing will blow your prop account.
- Adjust for ATR. If your usual position size on EUR/USD gives you a $500 risk with a 30-pip stop, that same dollar risk on gold might require a 100+ pip stop based on current ATR. Your position size must shrink proportionally.
- Account for event risk. Before EIA or FOMC, either flatten your commodity exposure or reduce size dramatically.
- Respect the drawdown math. If your prop account has a 5% daily drawdown limit, a single gold position shouldn't represent more than 2-3% risk.
The Calendar Approach
Rather than trading commodities like forex, looking for setups throughout the day, build your approach around the calendar:
- Monday: Assess weekly structure. Identify key levels in gold and oil. Check the week's scheduled events.
- Tuesday: Monitor API release at 4:30 PM ET if trading oil. Position accordingly or stand aside.
- Wednesday: EIA day. Either trade the inventory release with appropriate size and clear levels, or avoid oil entirely.
- Thursday-Friday: Trade the reaction and any developing trends.
Throughout the week: Use the DXY as your correlation compass. Check it before entering any commodity position.
What Most Prop Traders Get Wrong
- Trading commodities like forex pairs. The event sensitivity is different. The volatility profile is different. The correlation dynamics are different.
- Ignoring the dollar. Every commodity trade has implicit dollar exposure. Not watching the DXY is like trading a forex pair without checking the economic calendar.
- Using tight stops on gold. The market will hunt them. ATR-based stops or you're gambling.
- Holding through major events without adjustment. EIA, FOMC, CPI: these create discontinuous moves that ignore your support and resistance levels.
- Assuming the inverse correlation always holds. In crisis periods, safe-haven flows can drive gold and the dollar in the same direction simultaneously.
The 23-hour gold market and the weekly oil calendar aren't invitations to trade more. They're invitations to trade smarter.
The traders who succeed with commodities in prop accounts typically do so by trading less frequently but with better selectivity: focusing on high-probability windows around scheduled events, using the dollar relationship as confirmation, and sizing positions to survive the natural volatility.
Disclaimer
This content is provided by the Pipster Market Analysis Team for educational and informational purposes only. It is not investment advice and does not constitute a recommendation, offer, or solicitation to buy or sell any financial instrument. All trading and investing involves risk, including potential loss of capital. Past performance is not indicative of future results.